Monthly analysis of cross-strait container shipping market (with photos)
Guide: In April 2016, signs of Taiwan's economic recovery have strengthened, and a number of economic indicators have risen and are in an expansion area.cost of transporting goods from china
Twenty-one, Taiwan ’s economic indicators are recovering, and transportation demand is gradually recovering
4In April 2016, signs of Taiwan's economic recovery have strengthened, and a number of economic indicators have risen and are in an expansion area. In April, the Taiwan Manufacturing Purchasing Managers Index was 54.6%, a decrease of 0.3 percentage points from the previous month, but from the perspective of sub-items: supplier delivery time, existing raw material inventory levels, customer inventory, raw material prices The indicators of outstanding orders have increased to varying degrees, and most of them are in the expansion area. In addition, the prosperity indicators in the next six months rose by 4.9 percentage points to 56.7%, indicating that the island's enterprises and residents are optimistic about the future economic prosperity. Although the number of new orders, production, labor employment, new export orders, and the number of imported original logistics have declined, they are all in the expansion or increase range.
In March 2016, the import and export volume of the mainland to Taiwan showed a significant rebound. According to customs statistics, the import and export volume of the mainland to Taiwan in March remained flat year-on-year, of which the export trade volume increased by 11.8% year-on-year and the import trade volume decreased by 5.2% year-on-year The export volume of suitable containers increased. Among them, the export growth of traditional mechanical and electrical products, clothing, footwear, plastic products, and toys increased by 20.1%, 36.6%, 29.2%, 50.2%, and 13.5% year-on-year.
Market transportation demand is gradually recovering, but because of the different recovery speeds of supply chains at various ports, the trend of export container transportation demand has diverged. According to the statistics of the Taiwan Chamber of Commerce and Industry, the average weekly container shipments from Shanghai Port to Taiwan in March decreased by 0.4% compared with the same period of last year. .
Table 1. Growth rate of export container traffic of Shanghai Port to Taiwan route
|
date |
Year-on-year growth (%) |
| October 2015 |
-3.1 |
| November 2015 |
-1.2 |
| December 2015 |
-2.9 |
| January 2016 |
-2.6 |
| February 2016 |
-17.6 |
| March 2016 |
-0.4 |
Data source: According to the data of the Chamber of Commerce, the latest data is as of the end of March 2016
Twenty, transportation demand fluctuated slightly, and overall supply and demand remained sluggish
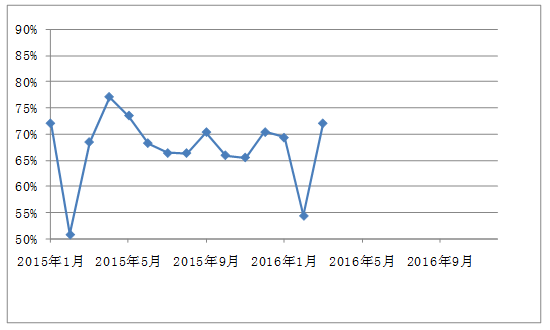
In the first half of April, transportation demand continued to recover, but as flights returned to normal, capacity supply accelerated and supply-demand relations improved, and the overall supply-demand relationship remained sluggish. According to the statistics of the Chamber of Commerce, in the first half of April, the average weekly supply of the Shanghai-Hong Kong-Taiwan route has risen above 7000TEU, an average increase of 4.2% from the previous month, and the same futures volume has increased by 3.2% from the previous month. The supply-demand relationship has not continued to improve. . According to the statistics of the Chamber of Commerce, in the first half of April, the average space utilization rate of ships on the Shanghai-Taiwan route for each week was 71.4%, a slight decrease from the previous month's average. During the same period, the average weekly cargo volume in North China increased by 4.6% from the previous month, but overall supply and demand remained sluggish due to the recovery of transportation capacity.
Figure 1. Trend chart of average utilization rate of ships in Shanghai Port and Taiwan route

Data source: According to the data of the Chamber of Commerce, the latest data is as of the end of March 2016
Thirty-three, the market foundation has not been improved, and the freight index has dropped overall.
The market capacity increased rapidly in April, offsetting the benefits brought by the recovery of cargo volume. The market conditions failed to maintain the upward momentum of the previous month, and freight rates fell on most routes. In terms of export markets: East and North markets, the supply-demand relationship has returned to pre-holiday levels, but is still at a low level. Fierce market competition affects the stability of freight rates. The market freight rates are repeated from time to time, and the overall decline slightly. In April, the average freight rates for shipments from eastern China and northern China to Taiwan were 839.24 points and 942.37 points, respectively, which were 1.3% and 0.6% lower than the previous month. In terms of the import market: fluctuations in transportation demand have caused market fluctuations, and the overall market freight rate has shown a downward trend. In April, the freight index for Taiwan to East China and North China averaged 970.40 points and 1018.91 points, respectively, which were 1.5% and 0.8% lower than the previous month.


